
Social Connection
My Role
Literature Review, User Research, Data Collection & Analysis, UI Sketching, Visual Designer
Year
March 2021 - May 2021
Skills
Conducting Diary Study, Leading Anti-solutionist Design Fiction Session, Holding Contextual Interview, Data Collection & Analysis, Figma, Usability Design & Testing
Overview
Overview
Sociological research suggests that modern American society continues to face obstacles in maintaining social connection, which is caused by decreasing household size, increasing graphical distancing, and emotional disconnection with families and friends. Since 2020, the outbreak of the COVID-19 pandemic has exacerbated these conditions due to restricted physical interactions, which has shown negative impacts on people's health conditions, such as health anxiety. However, research confirms that online social connections can mitigate those negative health effects.
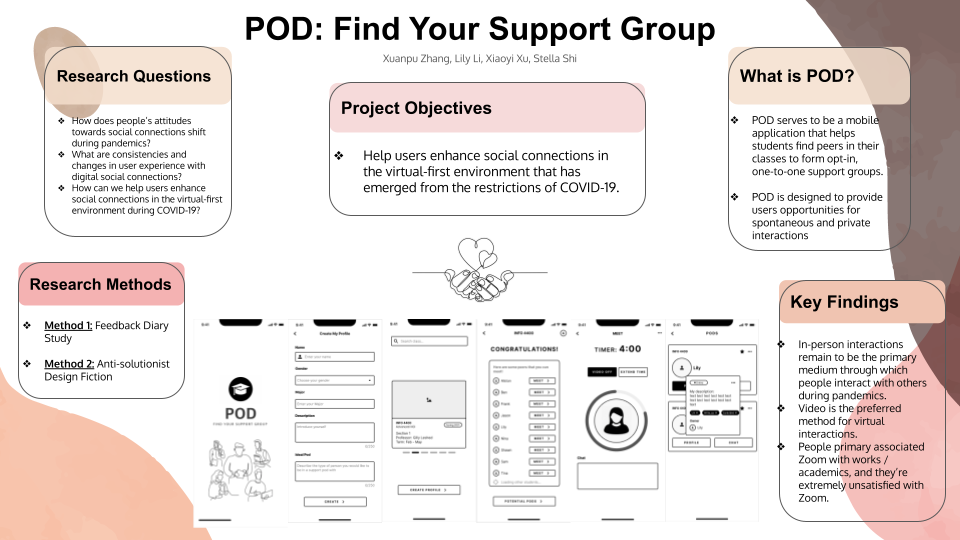
Our team understood the urgency and importance of bringing new technology tools into the social connection space during the pandemic. Therefore, we designed POD, a mobile application enhancing online social connections and providing users spontaneous and private interaction opportunities.
The initial outcome was to help students find peers in their classes to form opt-in, one-to-one support groups. In addition, we incorporated video, users' preferred medium for online social interactions, to facilitate students' communication with each other. Our app eventually received high satisfaction with usability and user experience, supported by heuristic analyses.
Problem
Our project targeted single young adults working or studying from home, who have experienced significant disruptions in social connections during the COVID-19. To explore their behavioral changes, attitude shifts, and experience with digital social connections, our team conducted a series of user research, in a combination of contextual interviews and dairy studies.
Contextual Interview Affinity Diagram
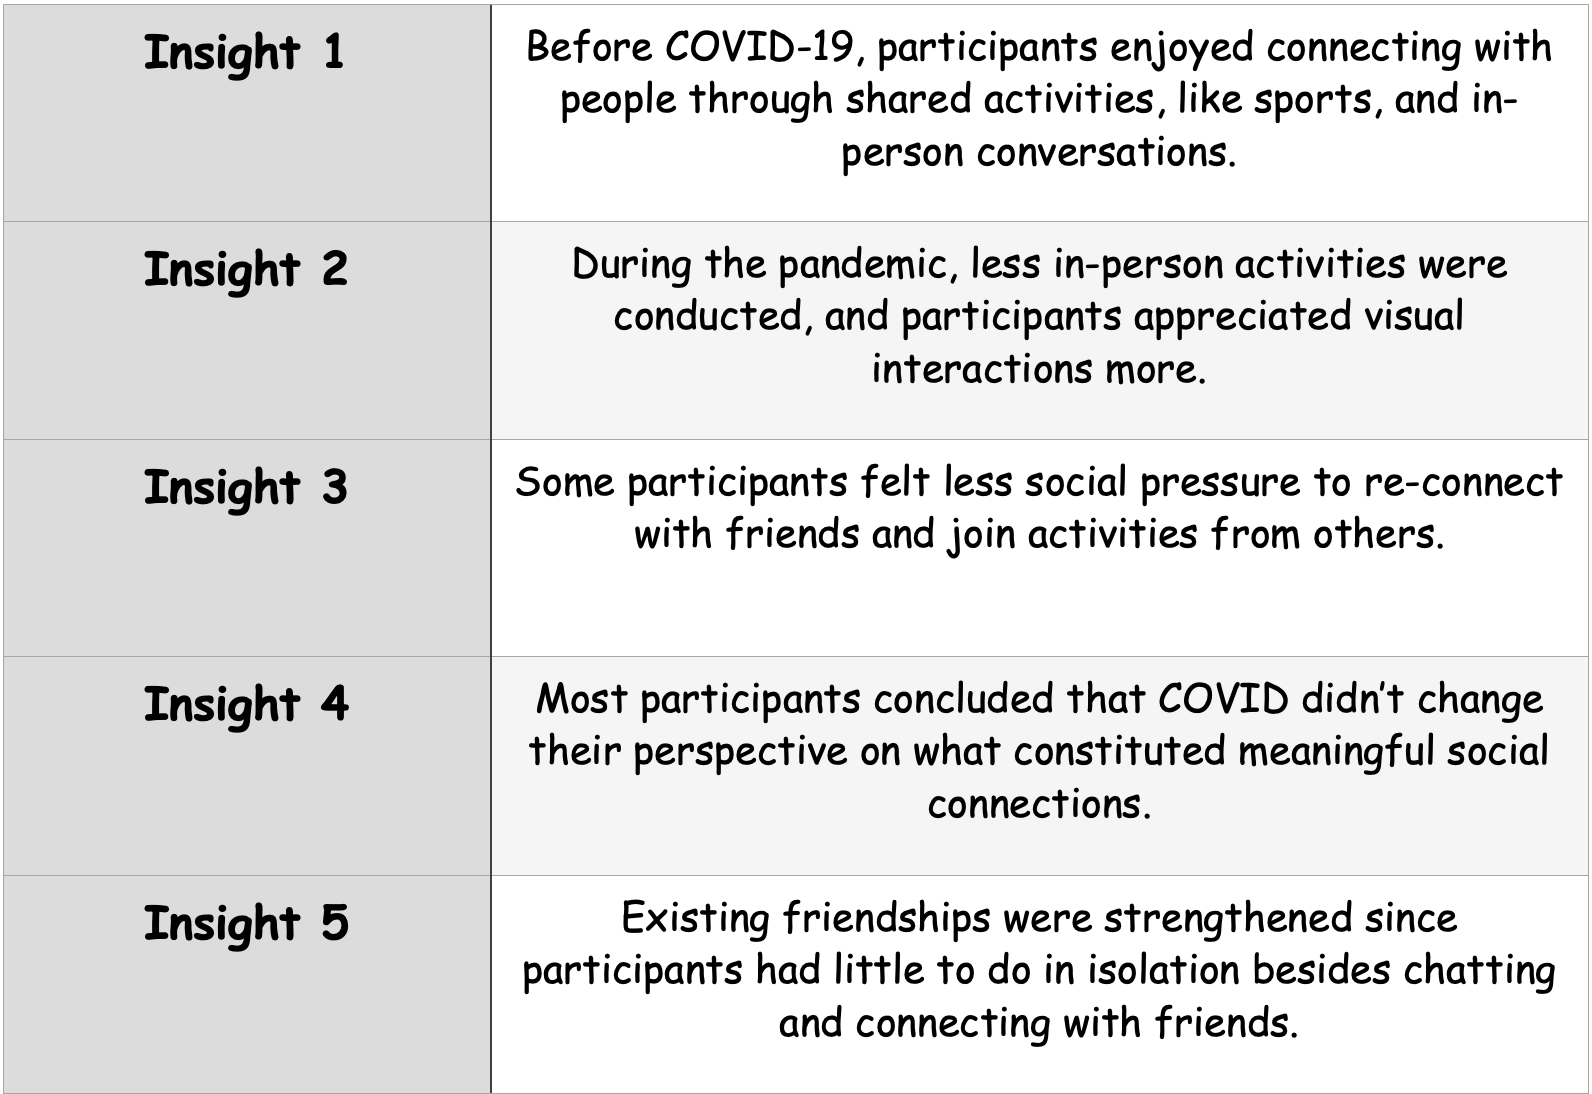
First, to gain insights on creating the diary study questionnaire and narrow down our study focus, we conducted four contextual interviews with participants from our potential user group and gained five insights. These insights reflected a shift from in-person to visually virtual interactions for social connections, lower social pressure felt due to social interactions, a high constituted meaning of social connections, and stronger relationships built during the pandemic.
Second, we recruited 7 participants composed of 5 college students and 2 young adults in the early stage of their professional careers. During the diary study, participants were asked to fill an online survey each time they were involved in social interaction. The questions asked who they connected with, why they set up/attended the interaction, how they connected with the other party, and their reflection on the experience.
Diary Study Summary
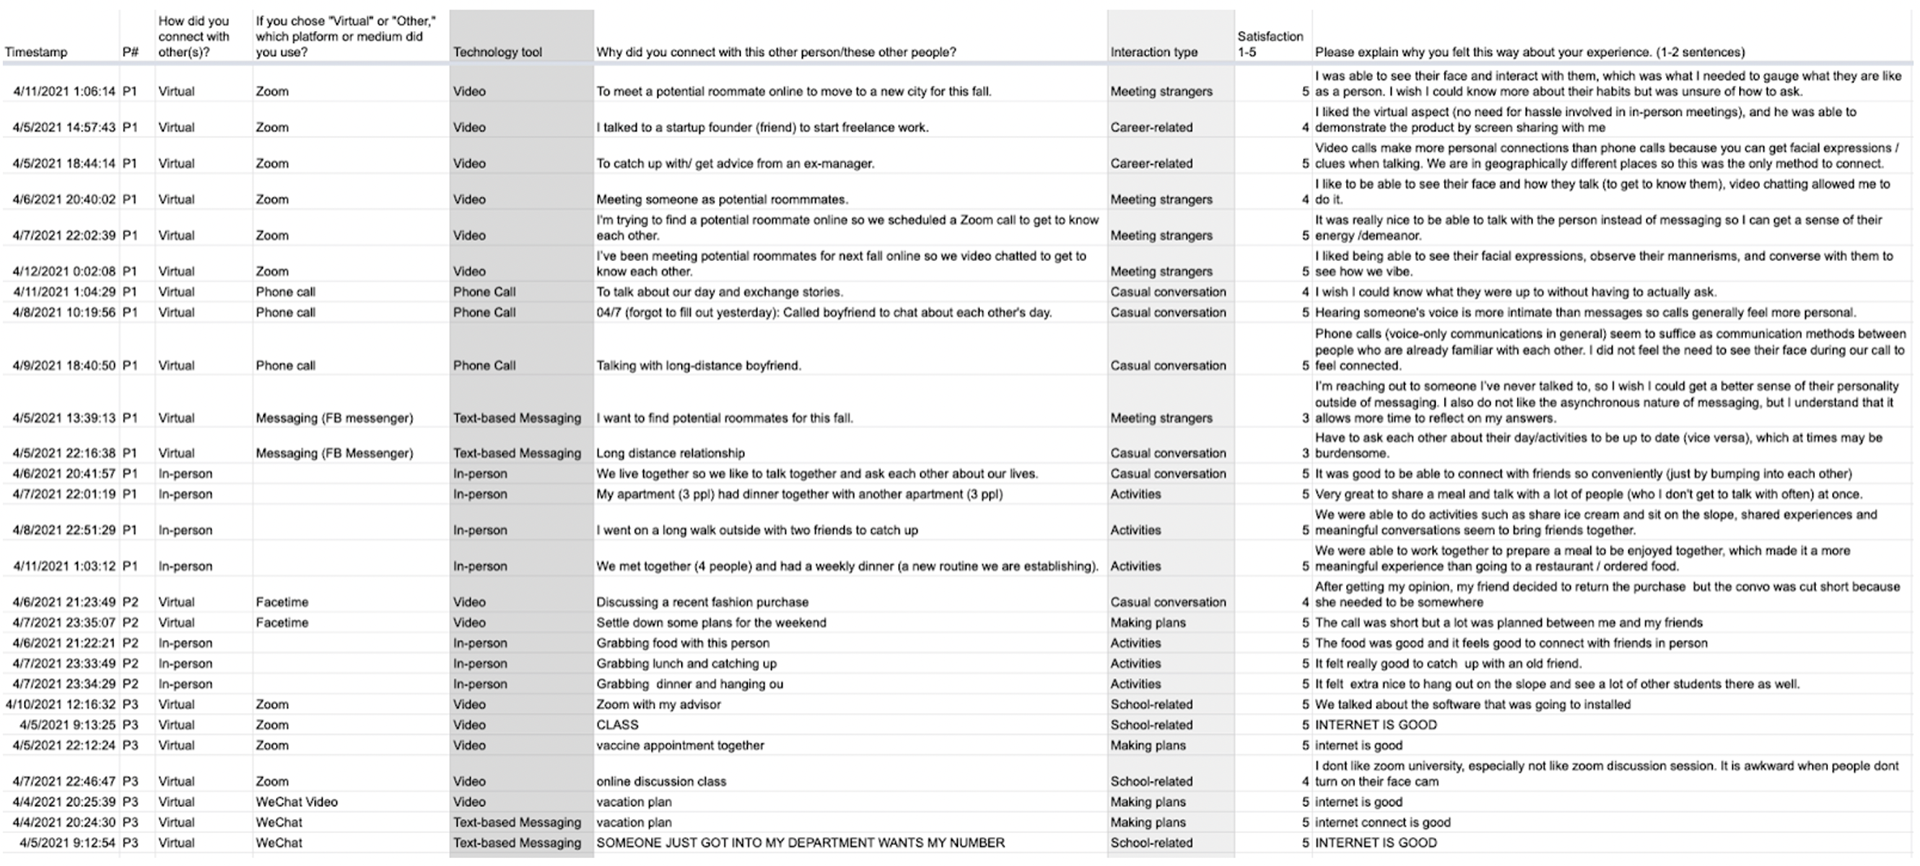
Diary Study Raw Data
Quantitative Analysis
Eventually, we received 93 diary entries from participants. To explore their social interaction channels and satisfaction with the existing solutions, our team conducted a quantitative analysis and gained 4 critical insights:
Insight 1: In-Person vs Virtual Interaction
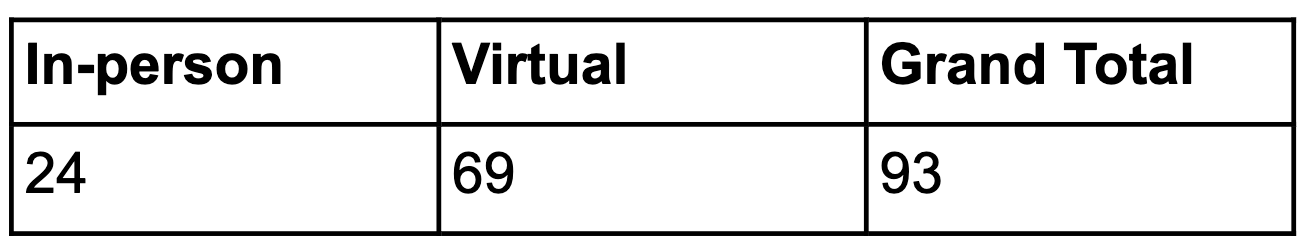
Table 1: Frequency of In-Person vs Virtual Interaction
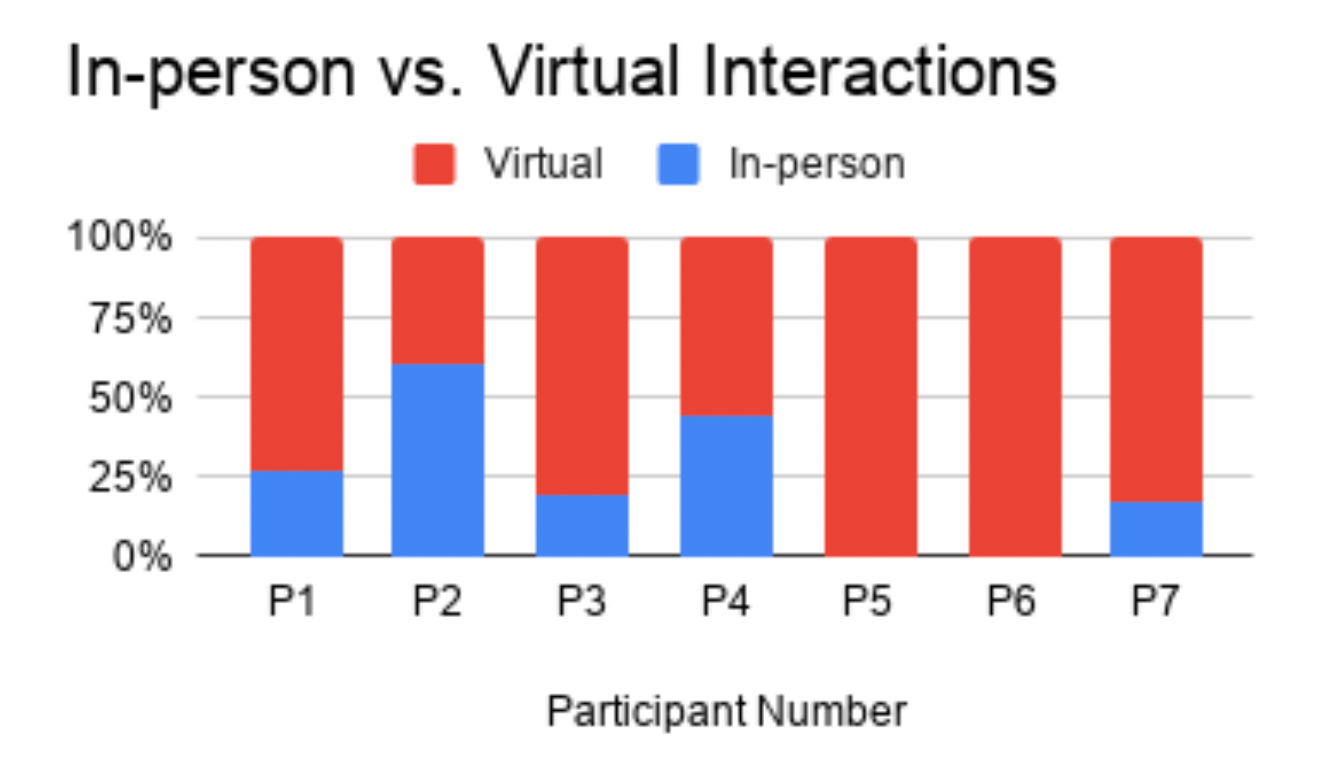
Figure 1: Frequency of In-Person vs Virtual Interaction by Participant
On average, 26% of participants' interactions that happened during the COVID-19 were in-person.
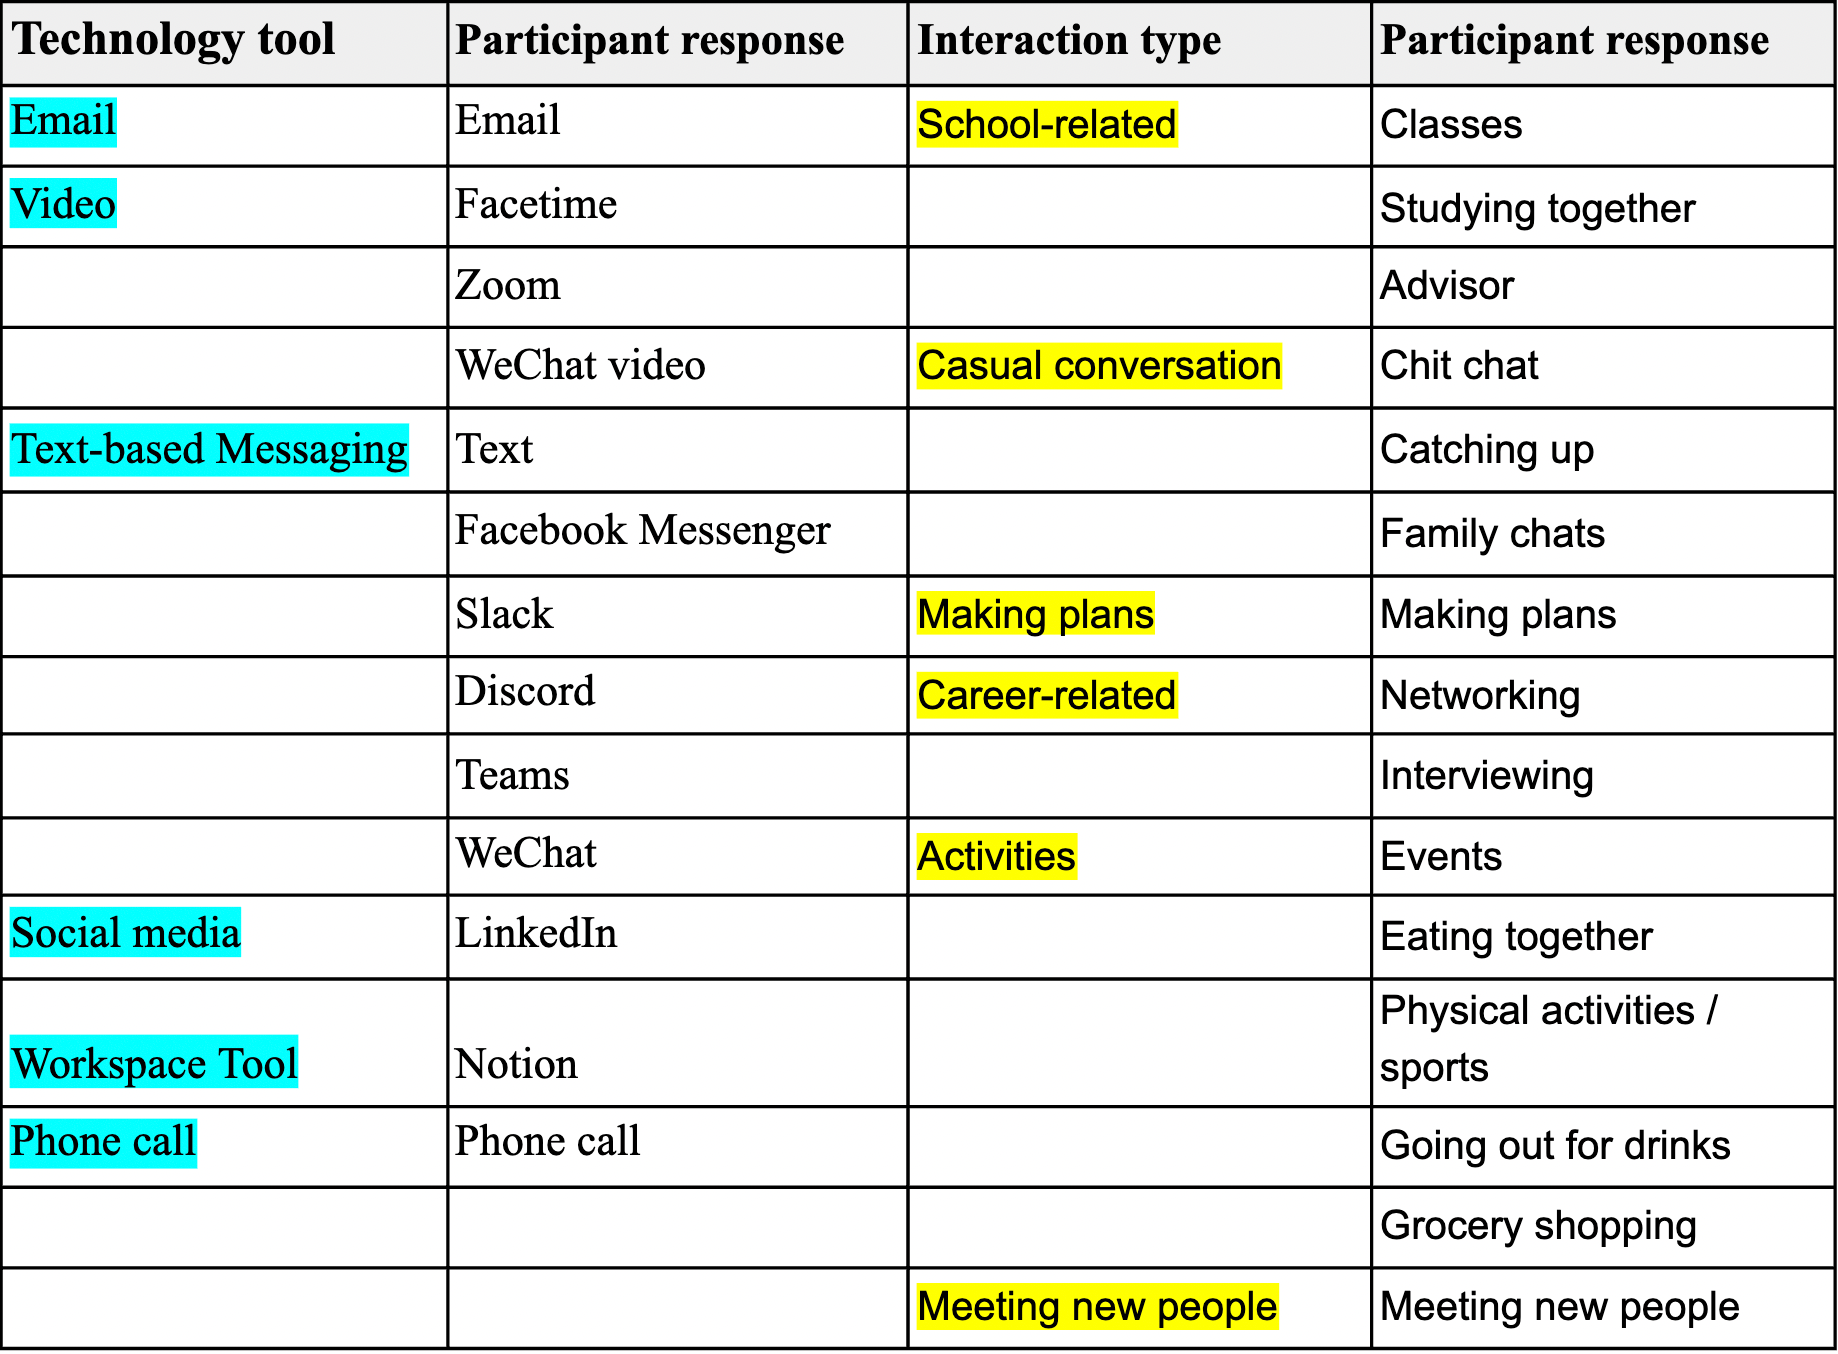
Insight 2: Virtual Interaction Channels
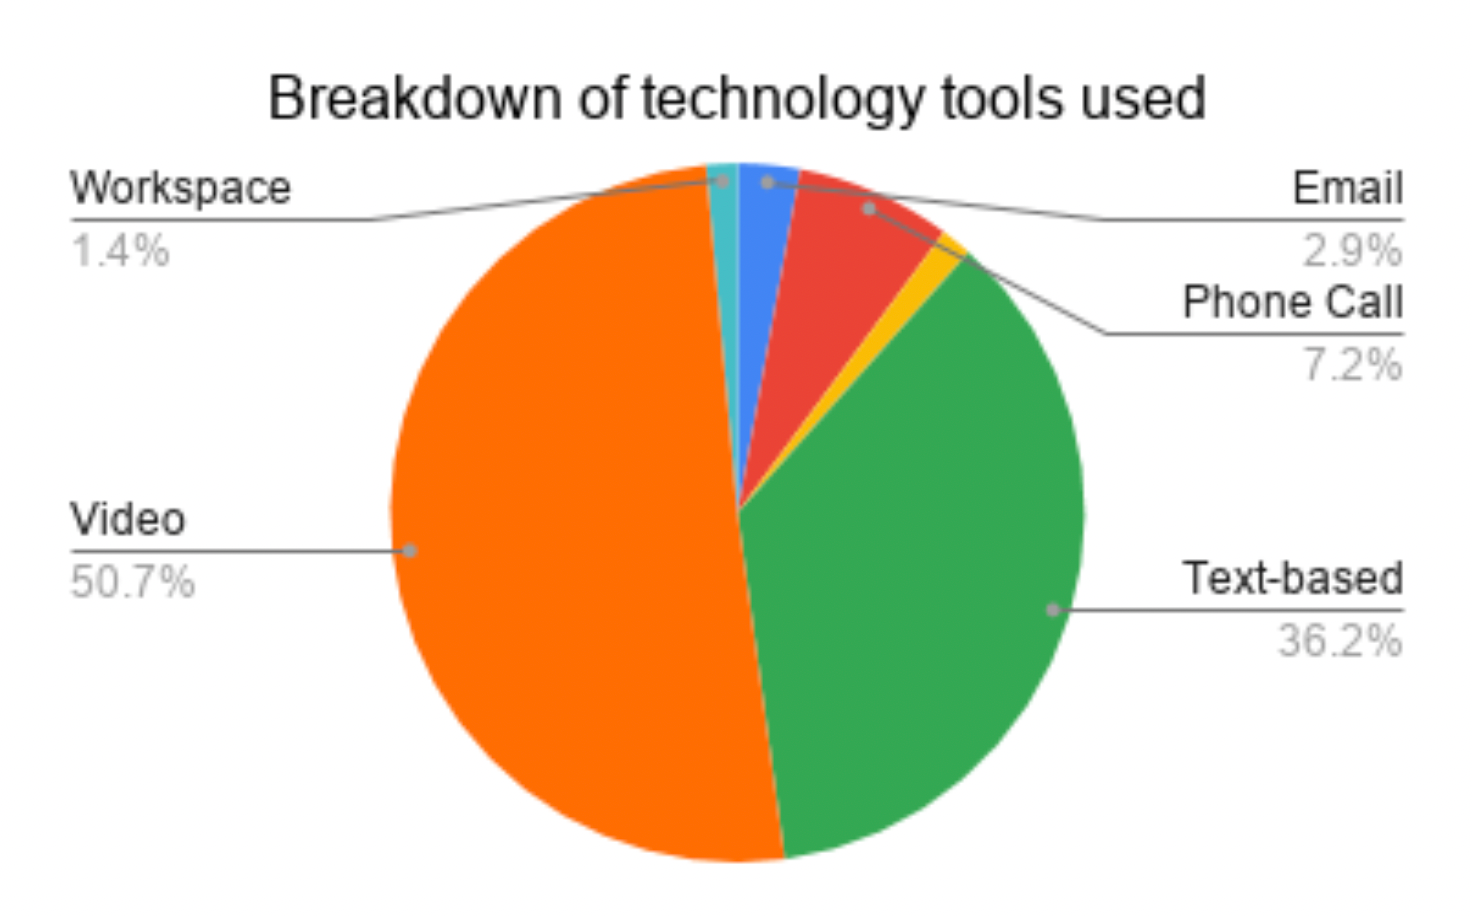
Figure 2: Virtual Tool Usage by Type
The video was the most popular technology tool used (50.7%), followed by the text-messaging platform (36.2)). However, the workspace tool is the least used tool for participants' social interactions.
Insight 3: Satisfaction With Interaction Method
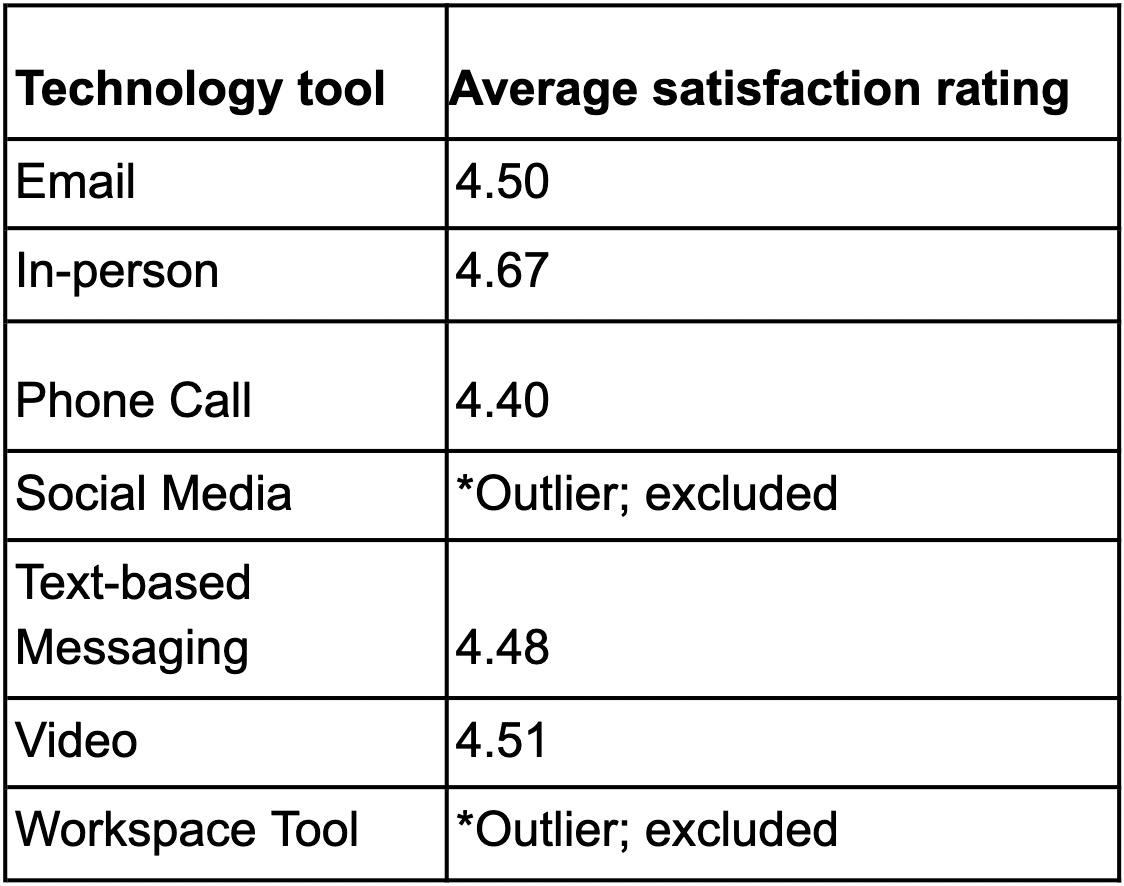
Table 2: Satisfaction Score of Interaction Medium
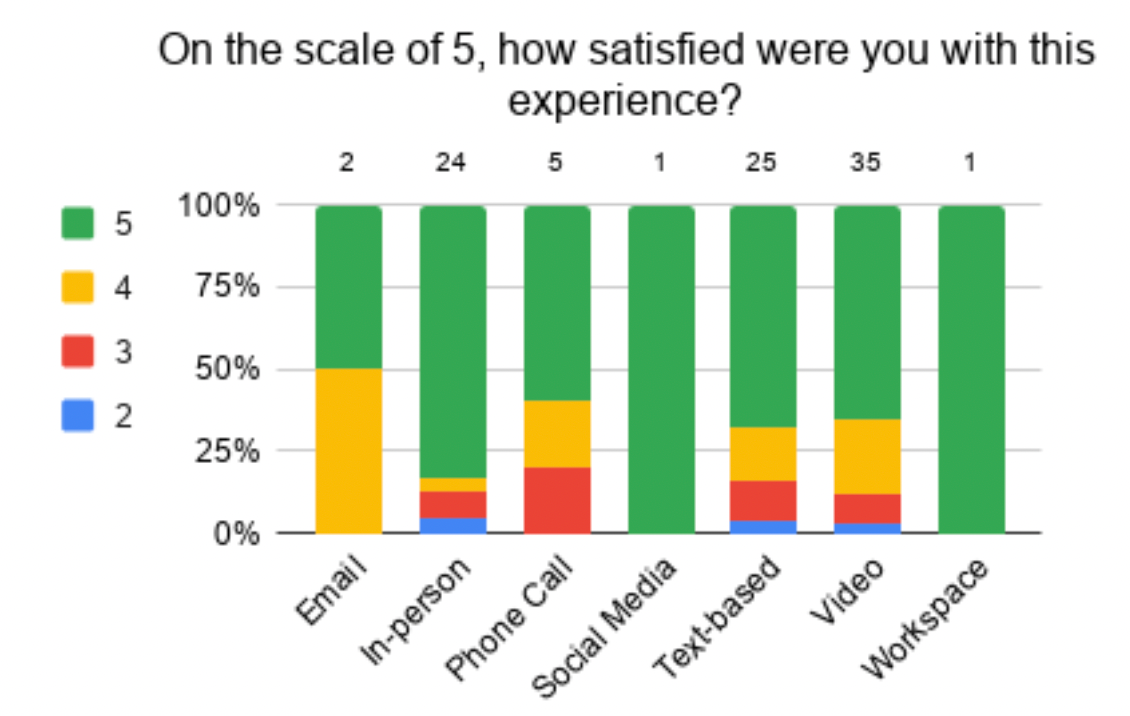
Figure 3: Satisfaction Score of Interaction Medium by Type
The in-person interaction received the highest satisfaction score (4.67/5.0), followed by video chatting (4.51/5.0).
Insight 4: Satisfaction With Connection Activity
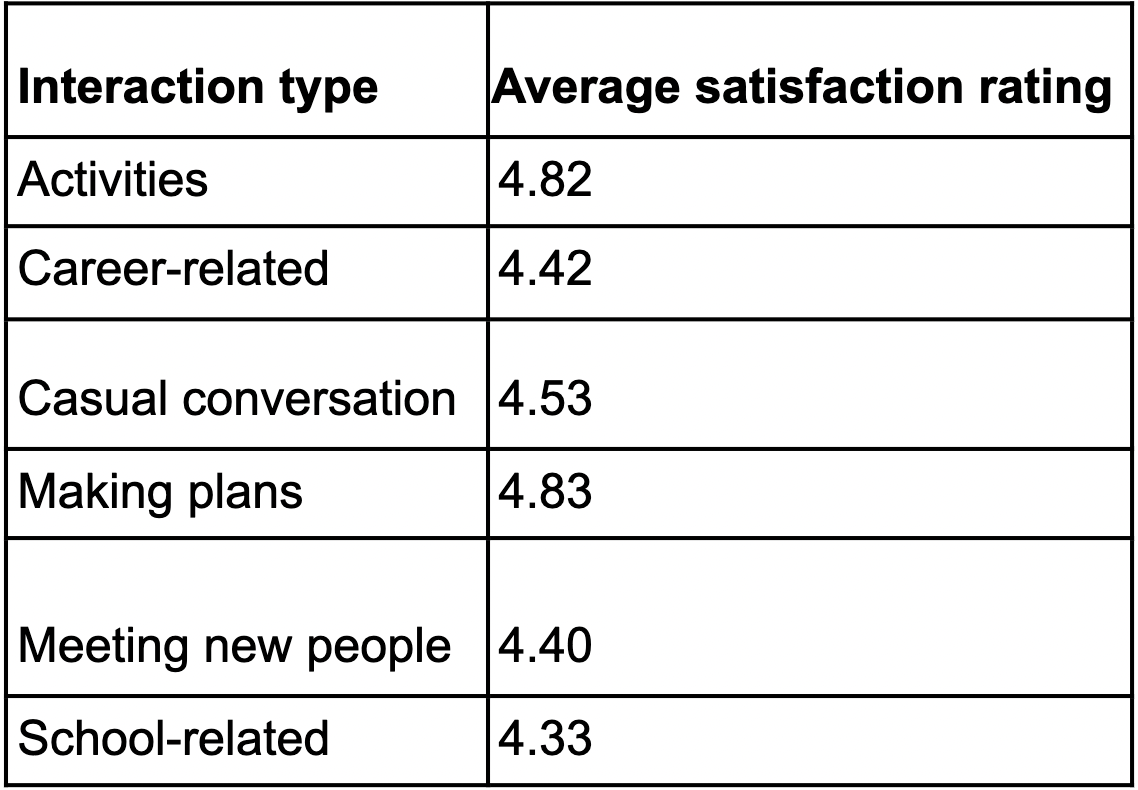
Table 3: Satisfaction Score of Interaction Activity by Type
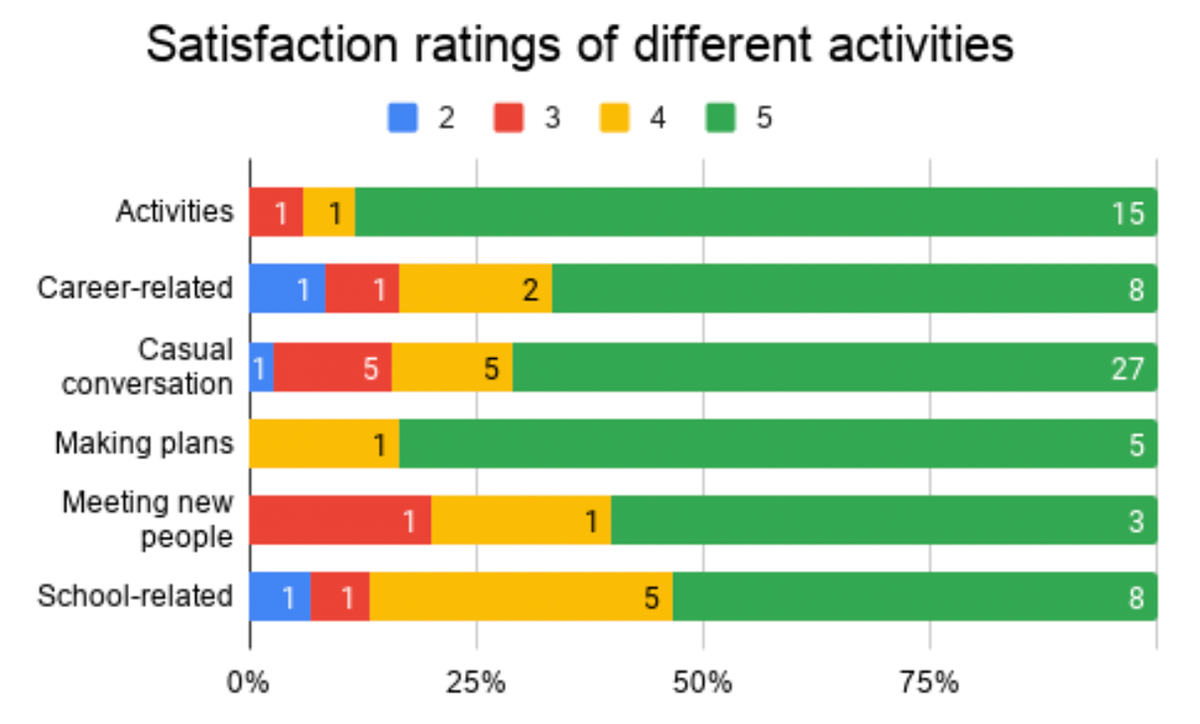
Figure 4: Satisfaction Score of Interaction Activity by Type
Making plans (4.83/5.0) and sharing activities (4.82/5.0) received the highest satisfaction scores, followed by casual conversations (4.53/5.0). This shows that the existing solutions have done a great job in fulfilling users' needs of completing these interactive activities.
Qualitative Analysis
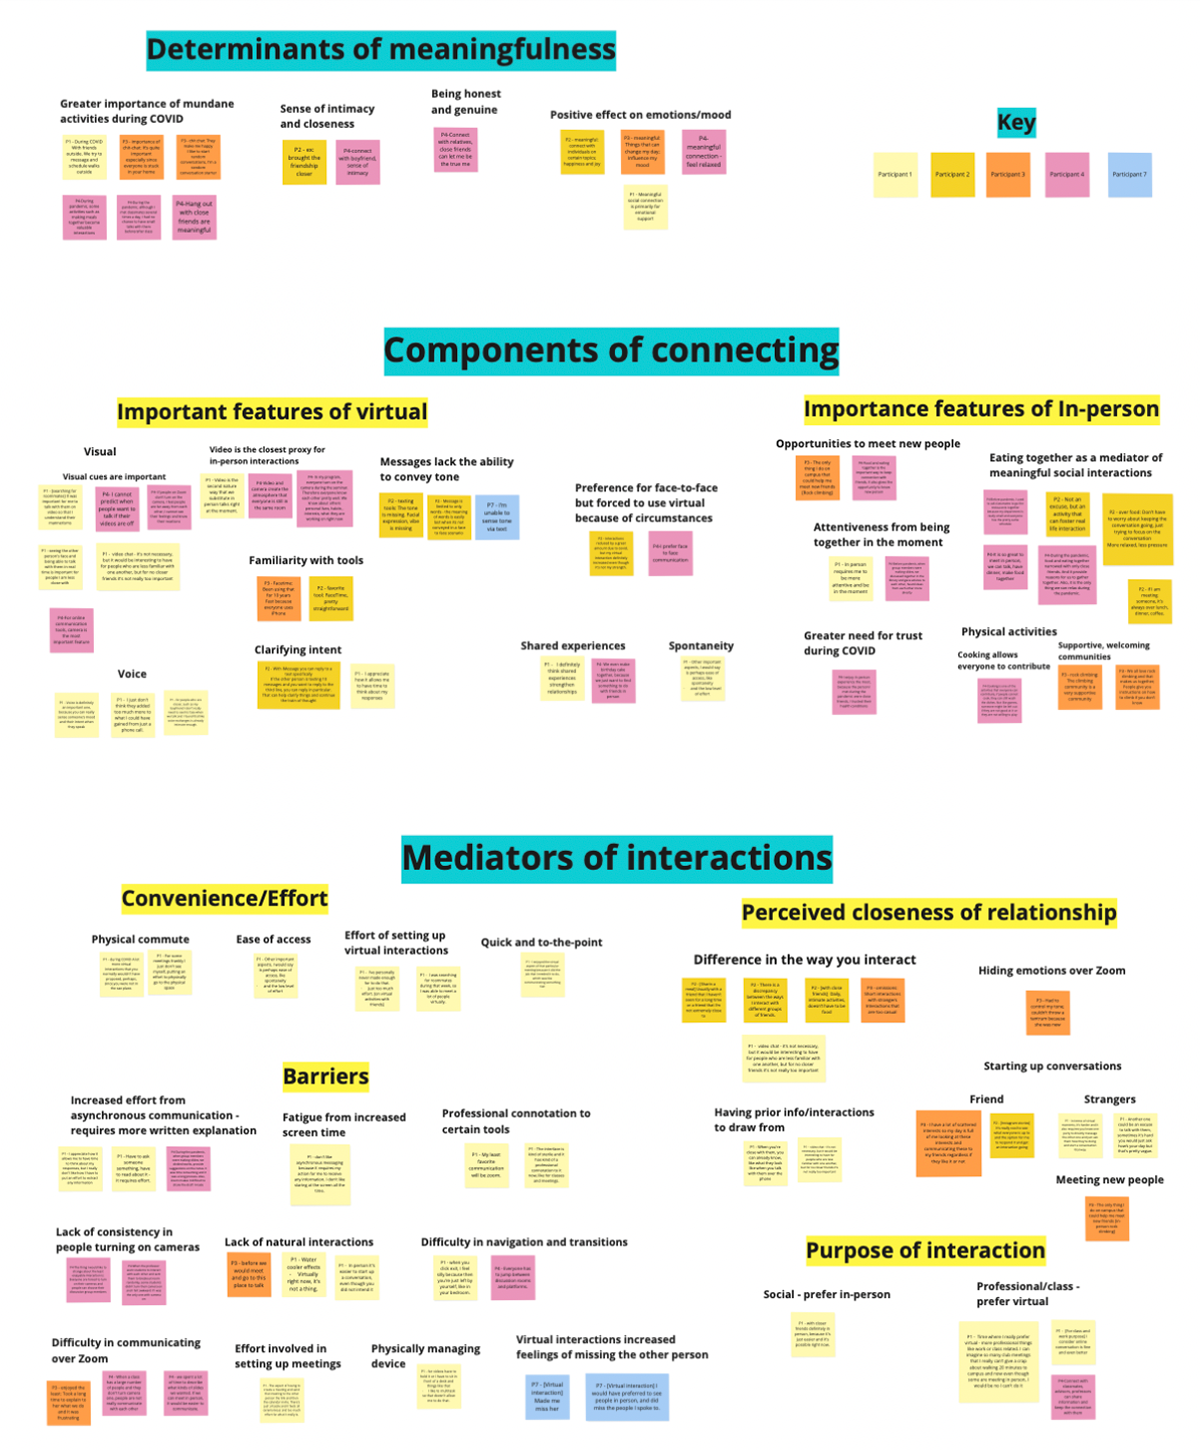
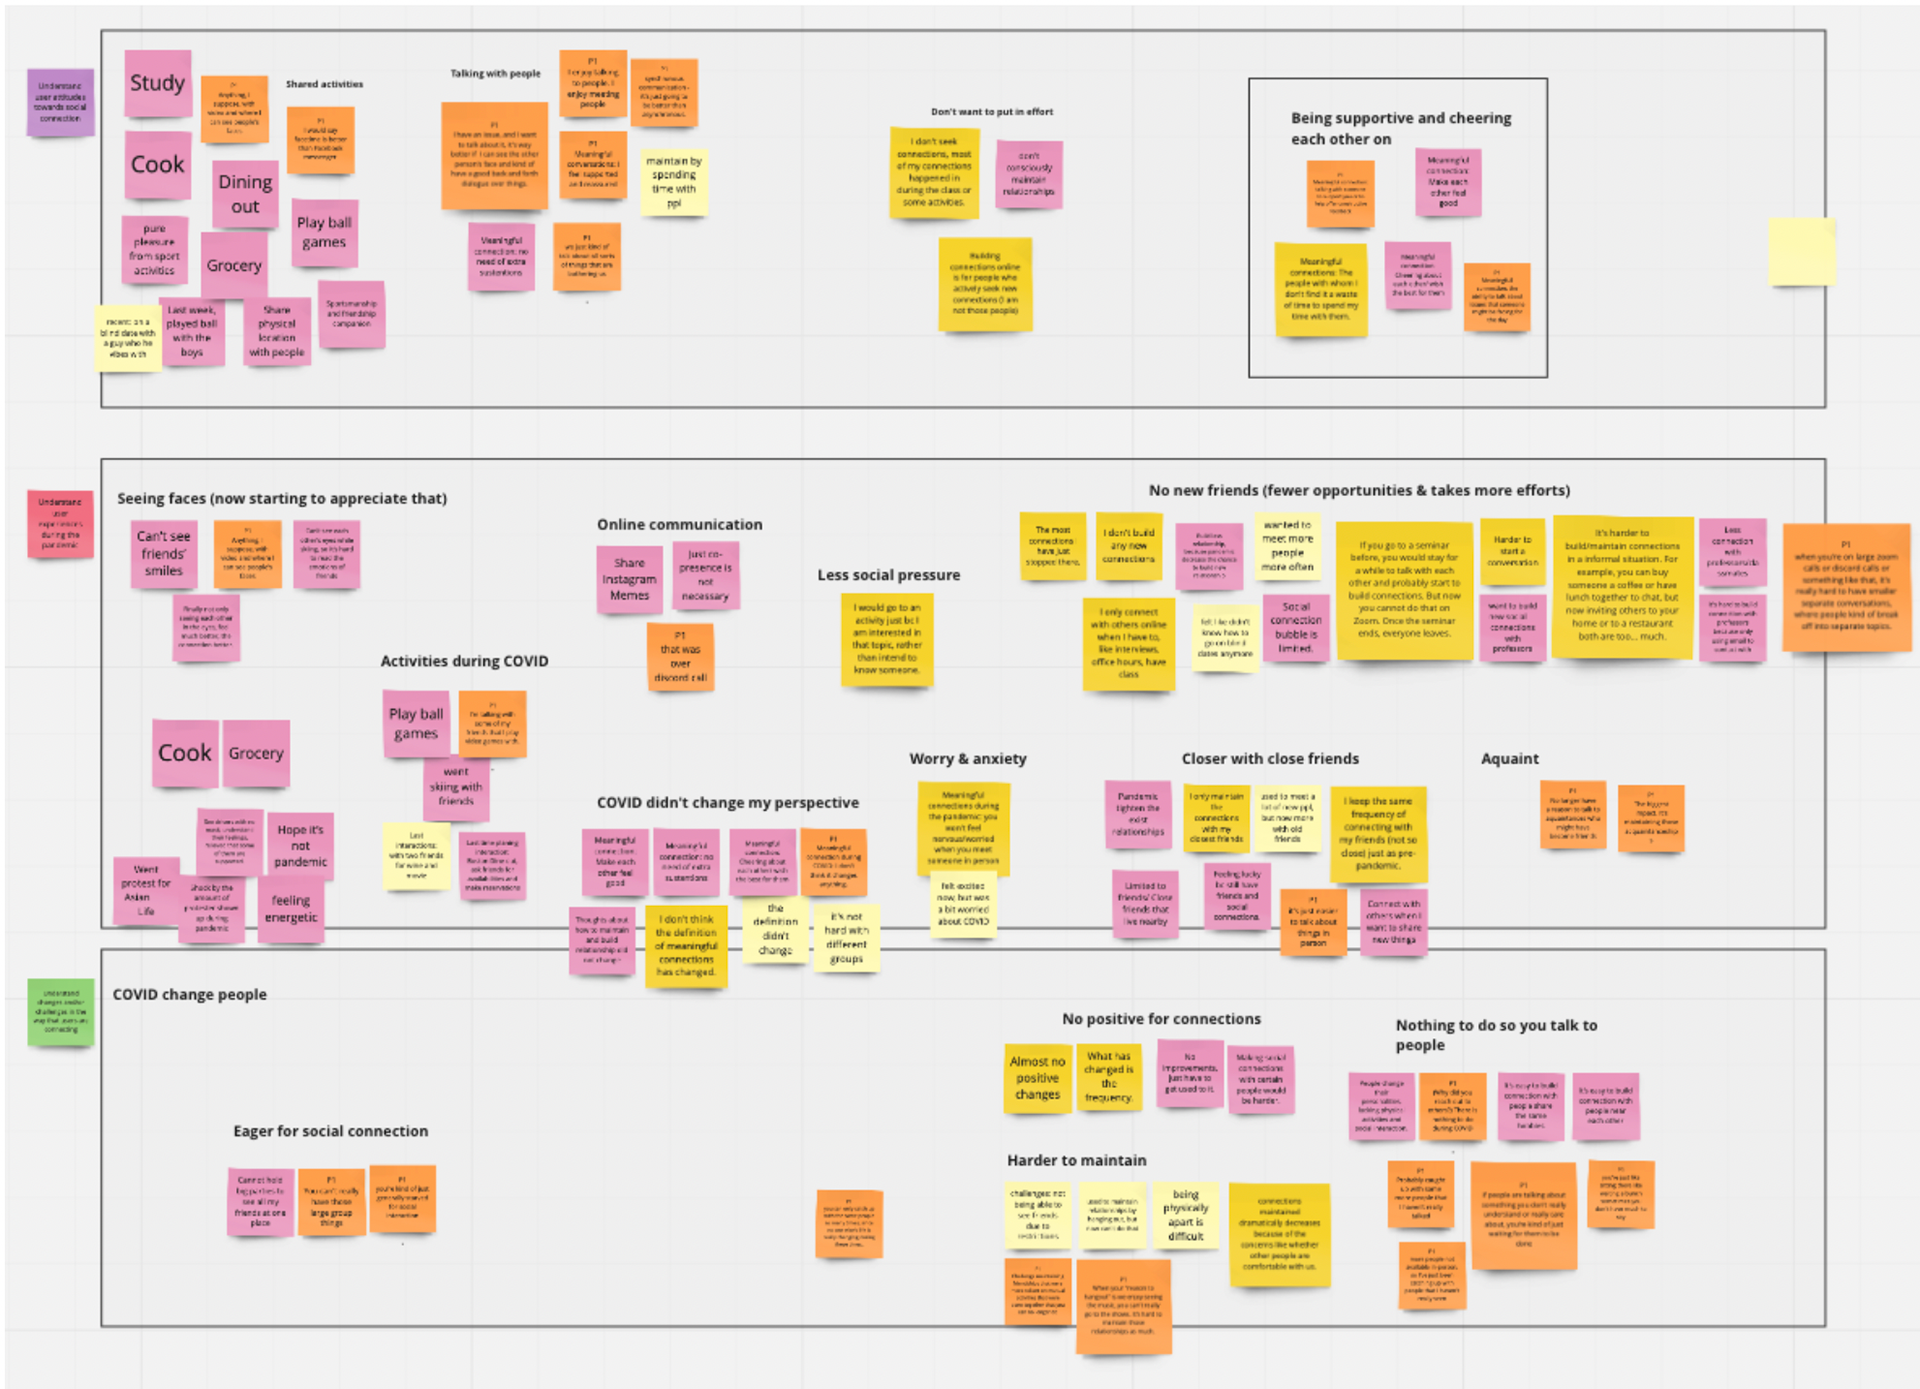
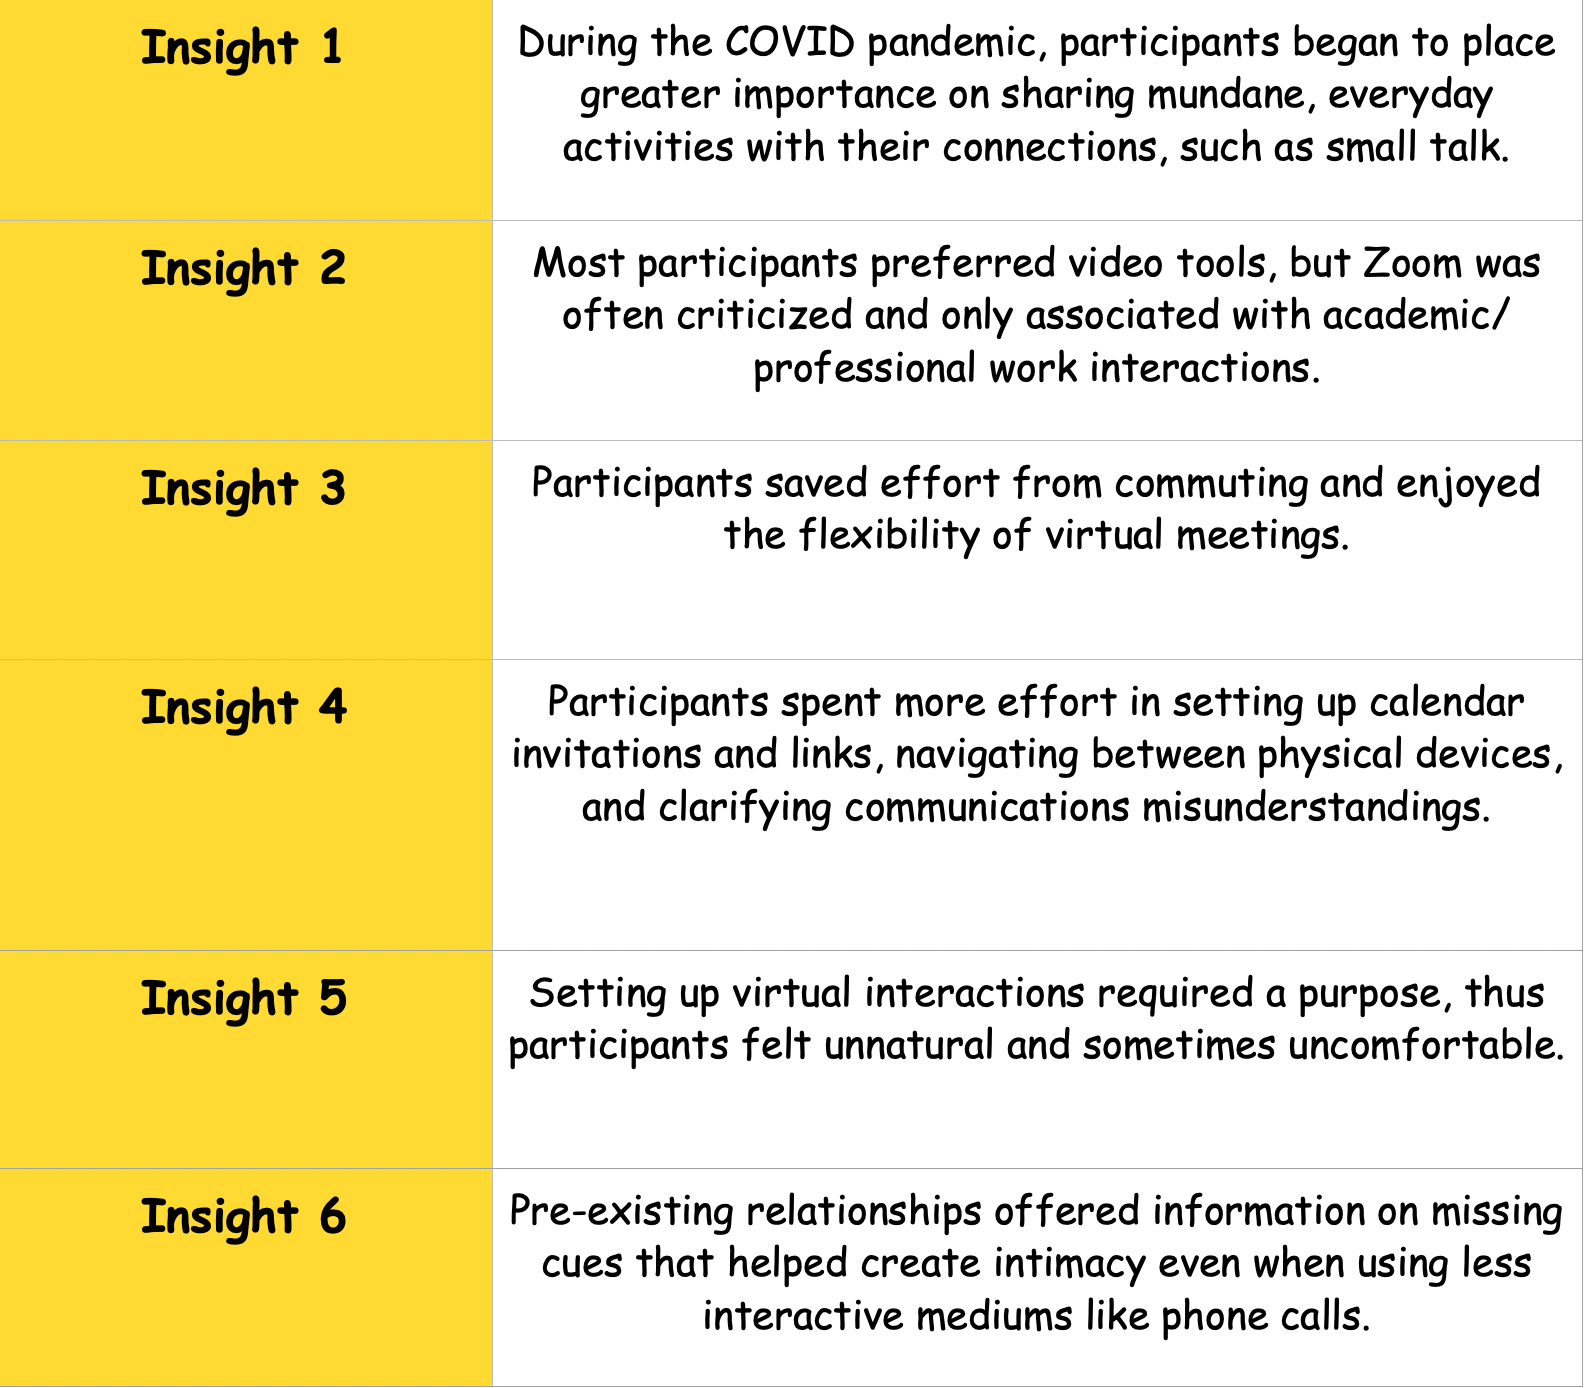
Diary Study Affinity Diagram
To gain an in-depth understanding of factors that trigger participants' negative and positive experiences with the existing virtual technology, our team also conducted a qualitative analysis and obtained six insights:
Although users do have access to digital technology designed for facilitating social connections, some tools are burdensome and require heavy involvement to function as desired. In using video conferencing to connect with family members, individuals are often required to take on a variety of technical, organizational, presentation, behavioral, and scaffolding work.
Therefore, users are looking for a more effortless technical solution to initiate and structure daily conversations with other parties.
Solution
Our project attempted to deliver a human-centered design for social connections. To thoroughly comprehend users' needs and truly implement them in the design, we decided to let users participate in the design process. We conducted 2 anti-solutionist Design Fiction sessions with 4 participants.
During the Design Fiction sessions, participants were asked to create un-useless "magic machines", which fulfill their social interaction goals.
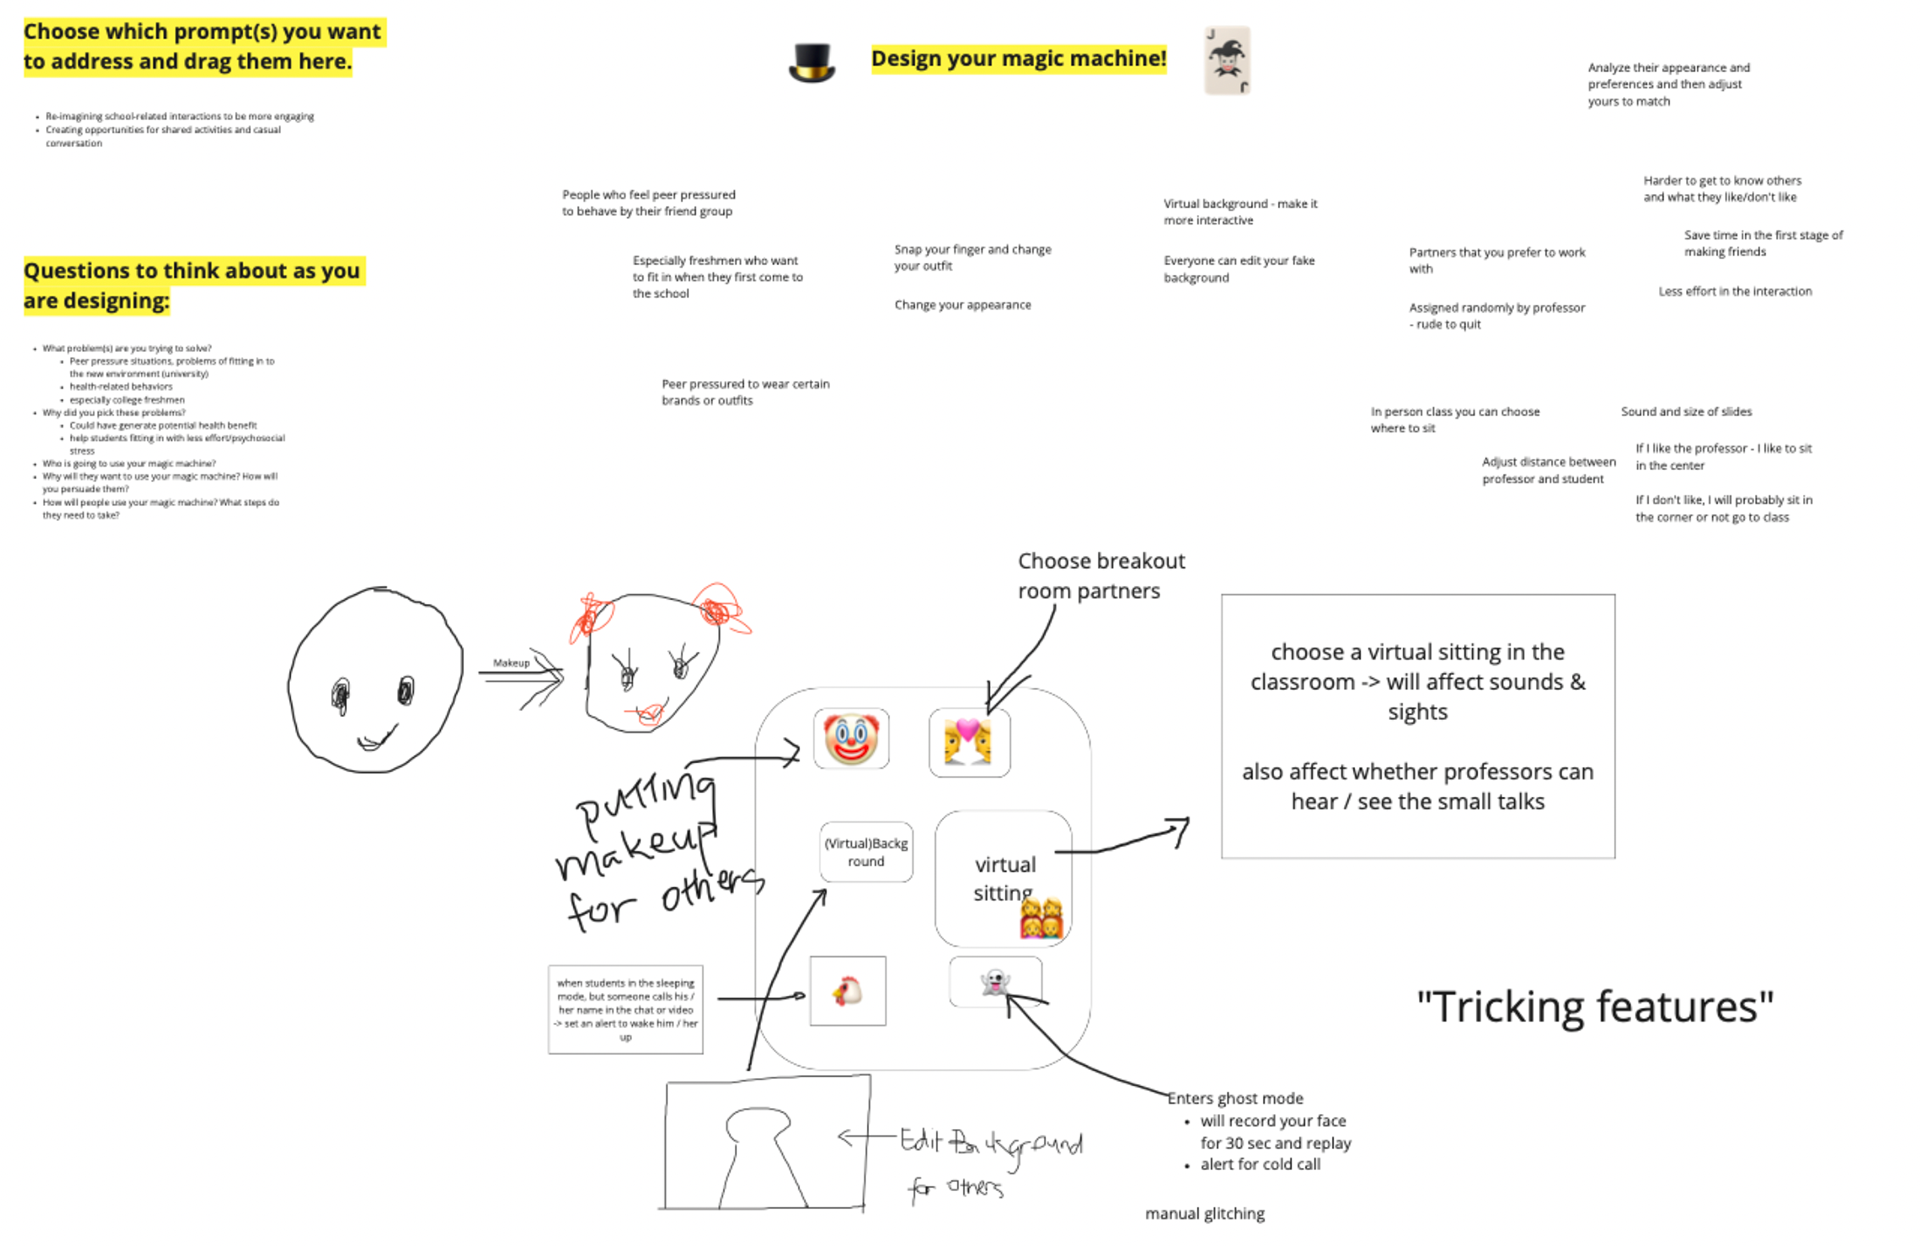
Design Fiction Sketch - Session 1
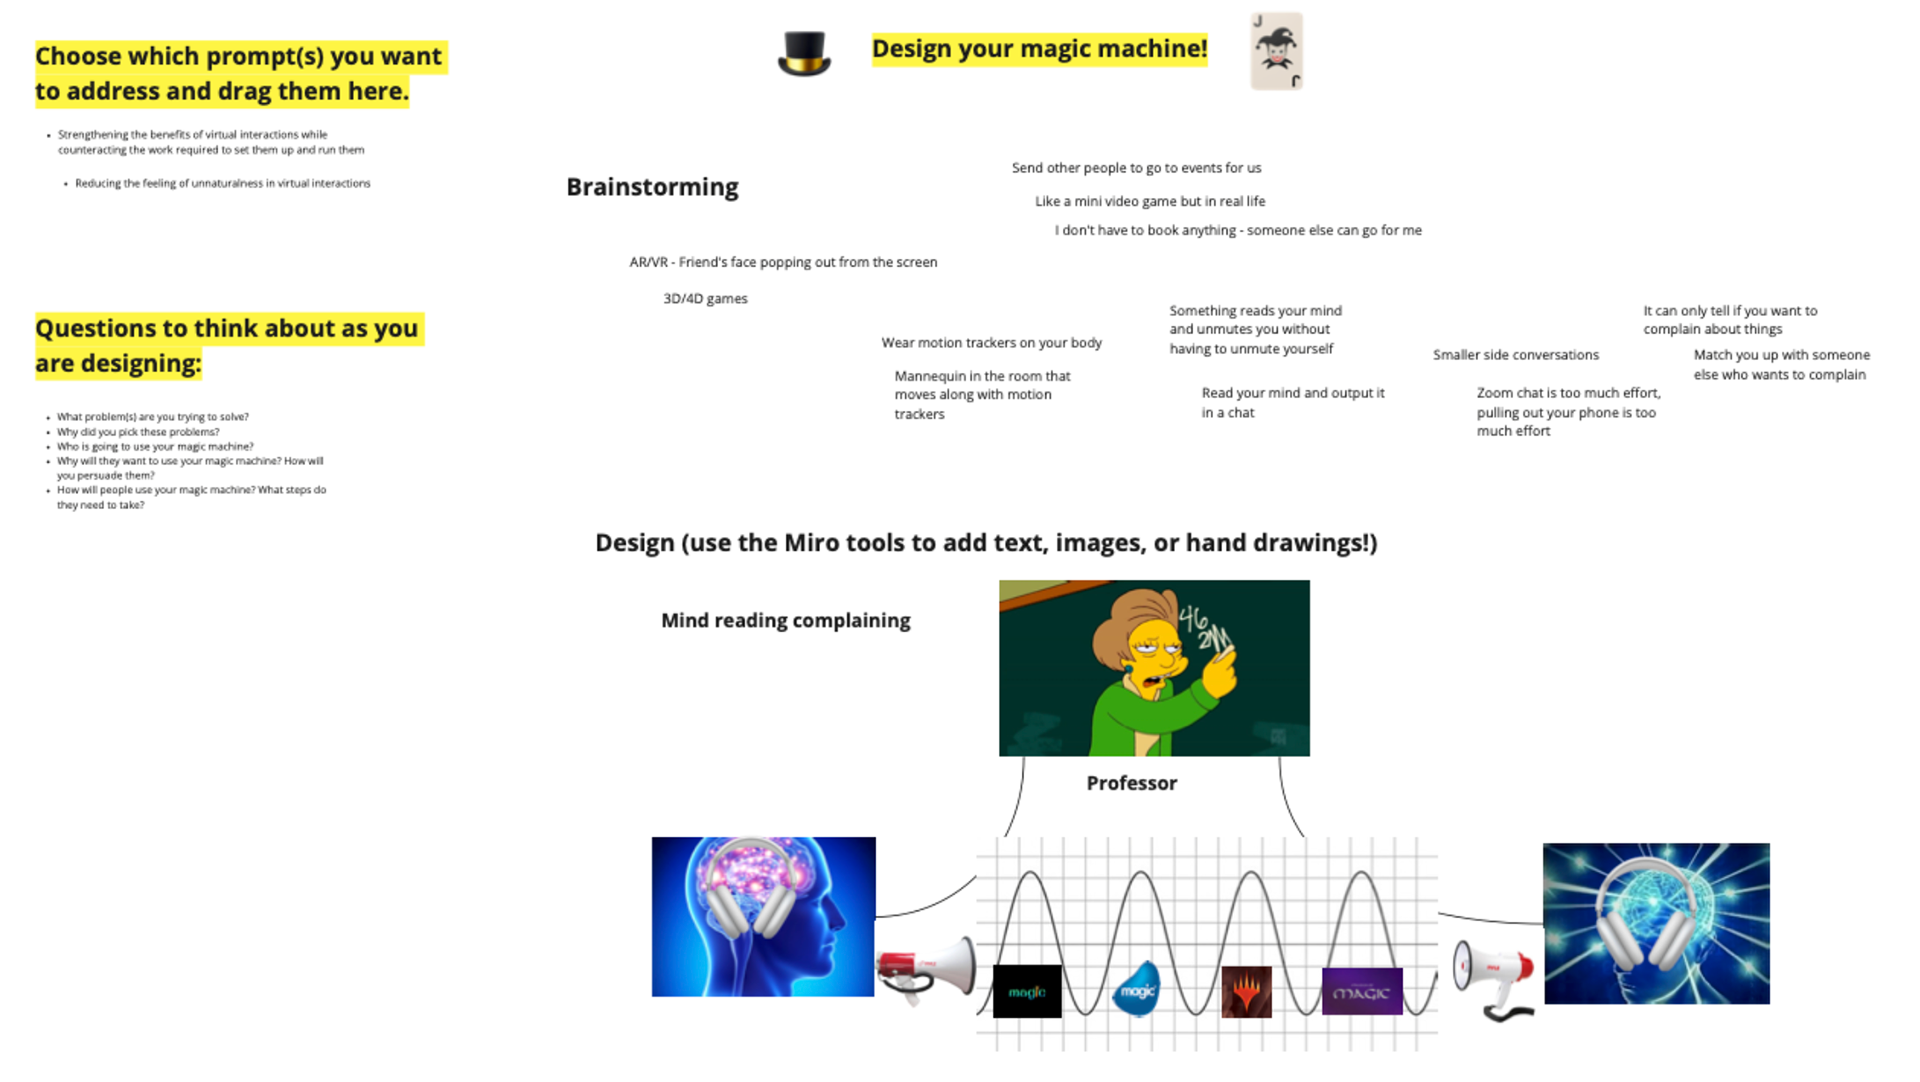
Design Fiction Sketch - Session 2
After the sessions, our team analyzed their design sketches and session notes. We ended up with 2 design themes shared by all participants:
Theme 1:
Participants are looking for spontaneous, private interaction opportunities that support relationship building
Theme 2:
Conversation and interaction friction result from participants' fear of judgment
Based on two themes, our team determined our final design objective:
The design will focus on creating opt-in, one-to-one interaction opportunities and helping students find peers in their classes to form support groups
Storyboard
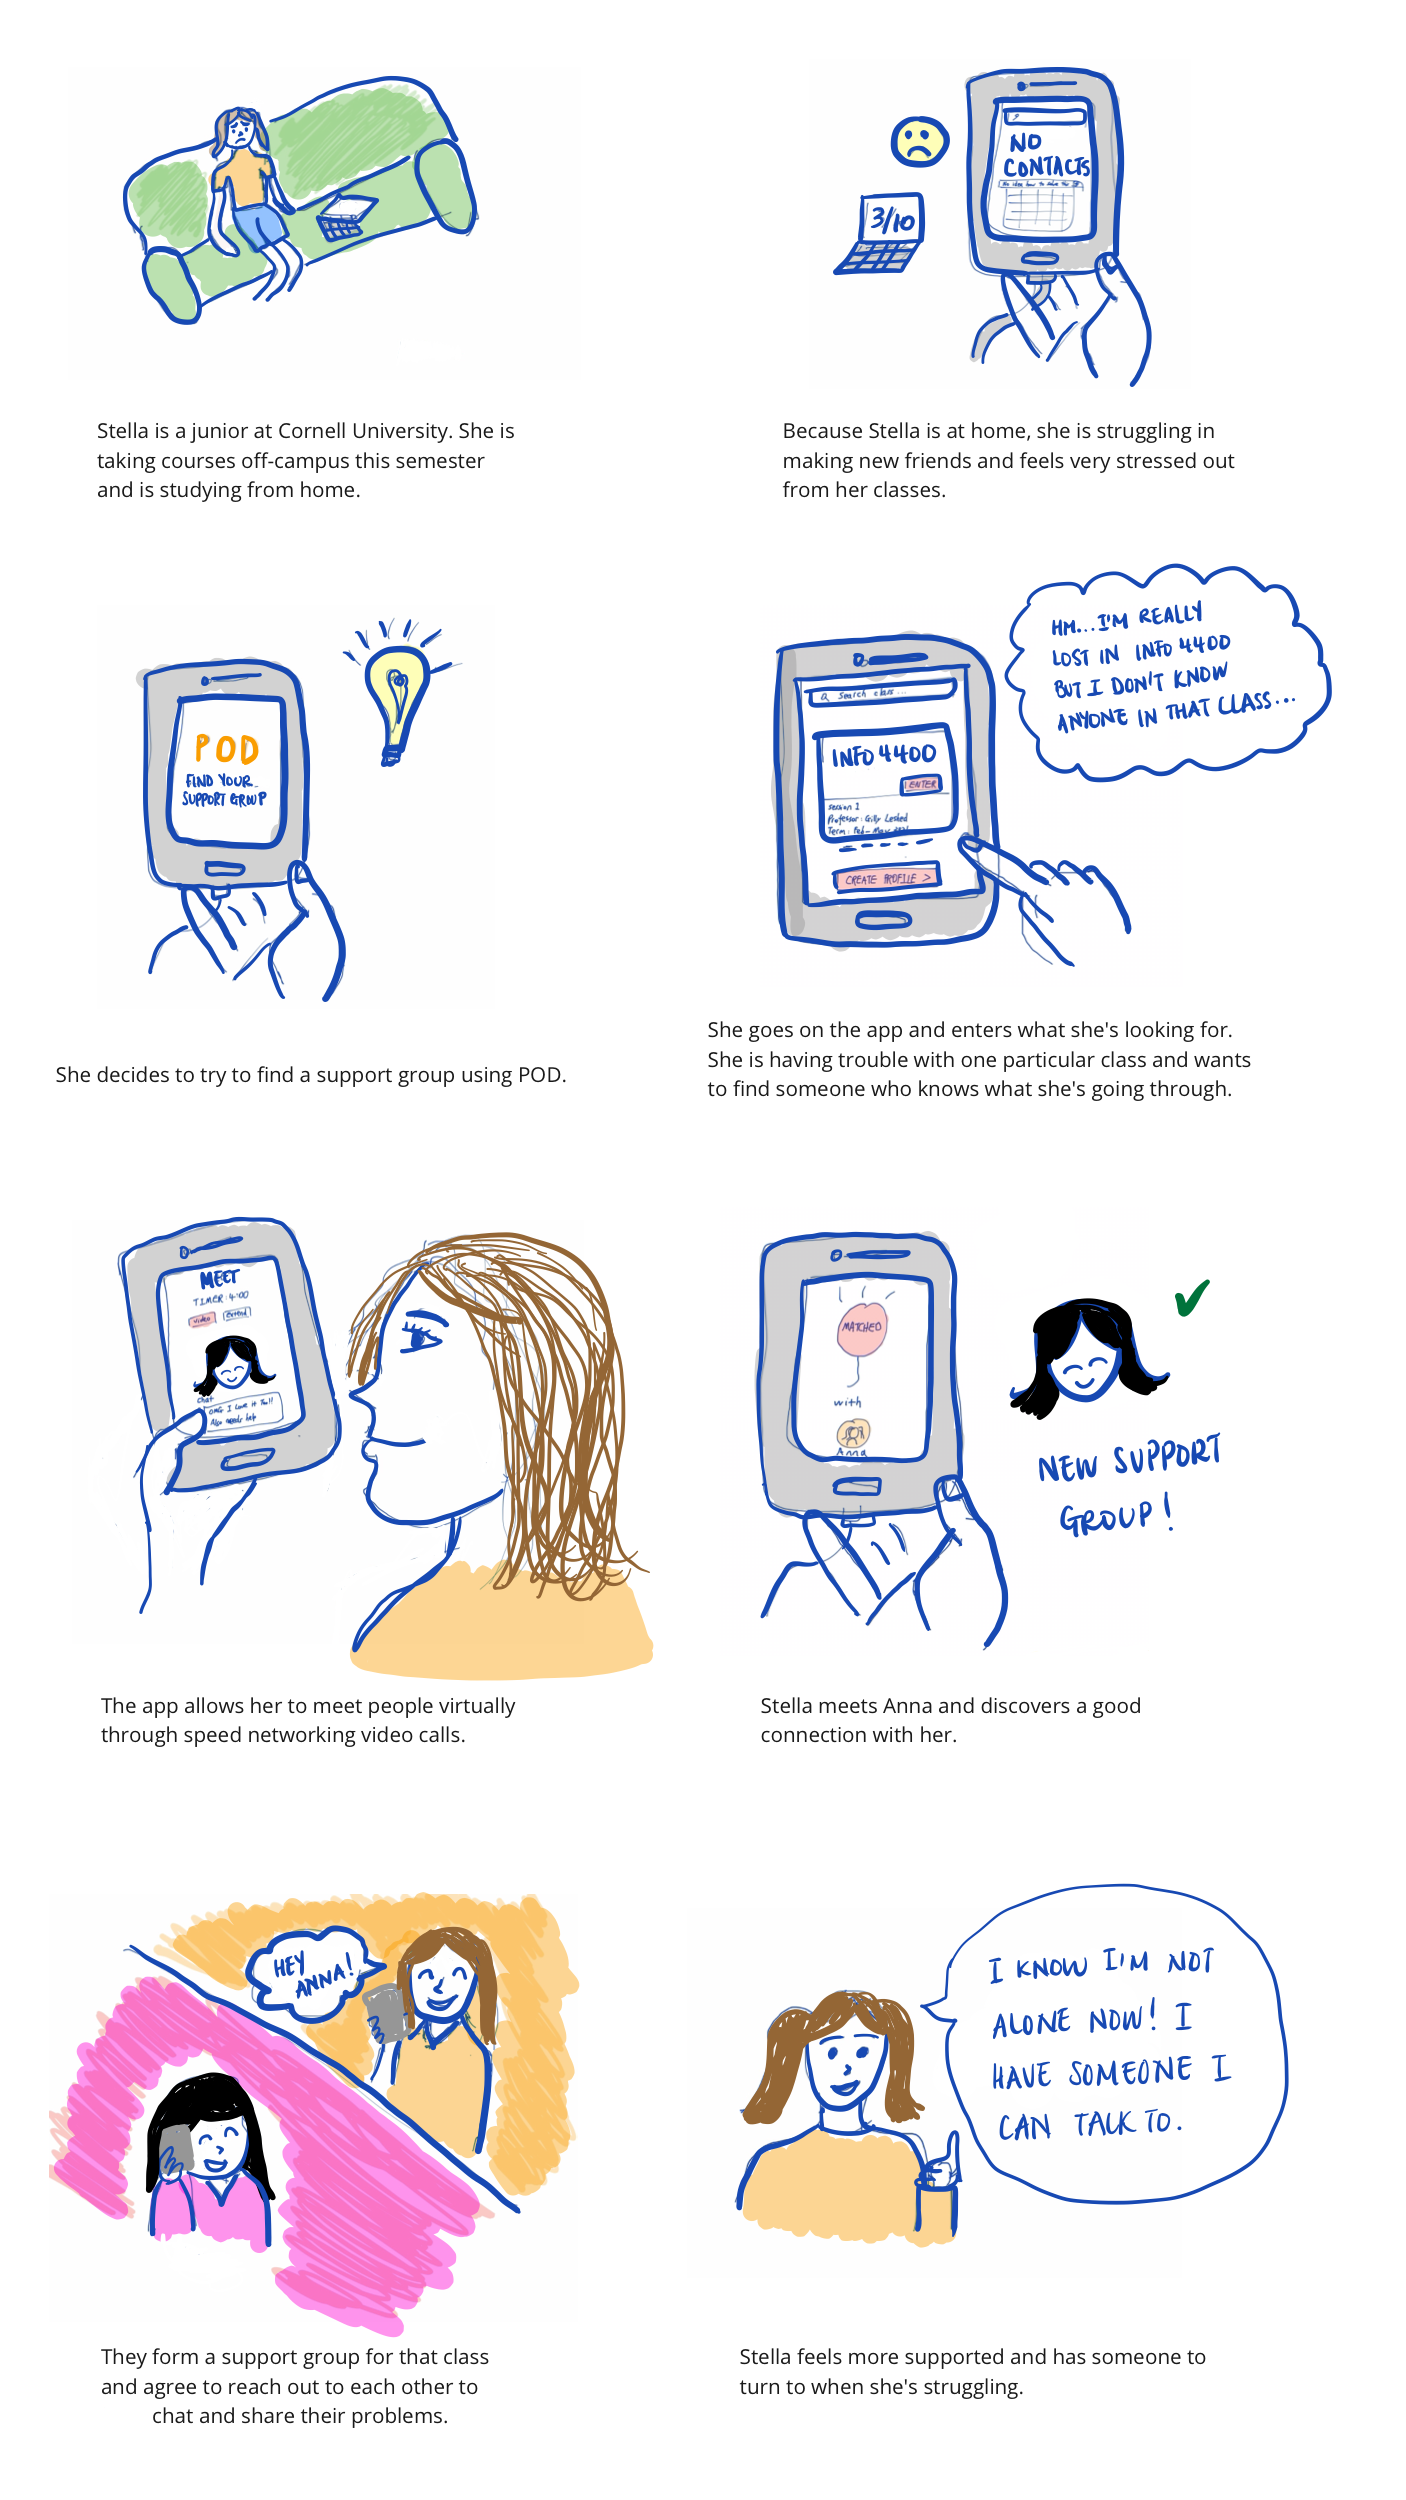
Storyboard
To determine the flow of UI of the prototype, we created a storyboard for the speed networking on POD. In the scenario, POD successfully helps Stella connect with a classmate to form a support group, and eventually, it reduces Stella's mental struggles resulting from the loneliness.
Prototype
Based on the storyboard, we created the prototype for the UI of POD. To test the usability and user experience of our design, we recruited a group of UX designers to complete heuristic analyses.
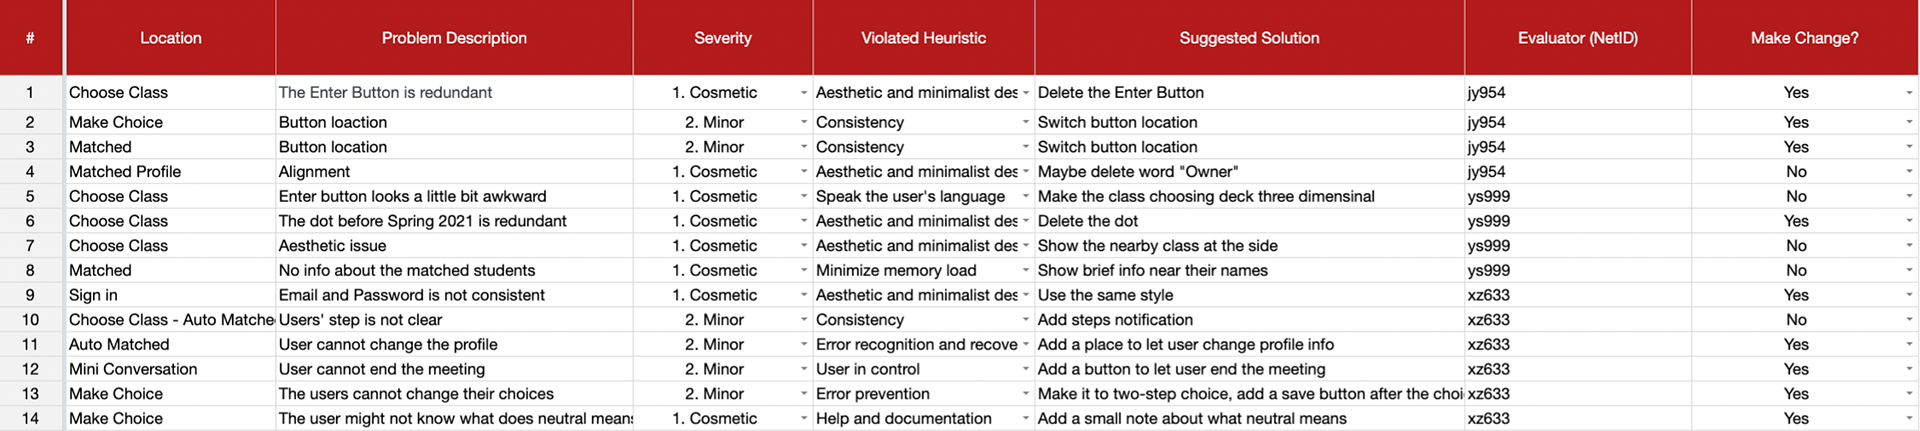
Heuristic Analysis
Our team adjusted and finalized the prototype after collecting UX designers' feedback, which can be accessed through the link: <https://www.figma.com/file/TLn52W4DDe0LNExieOMi9D/4400-FP-After-Evaluation?node-id=0%3A>.
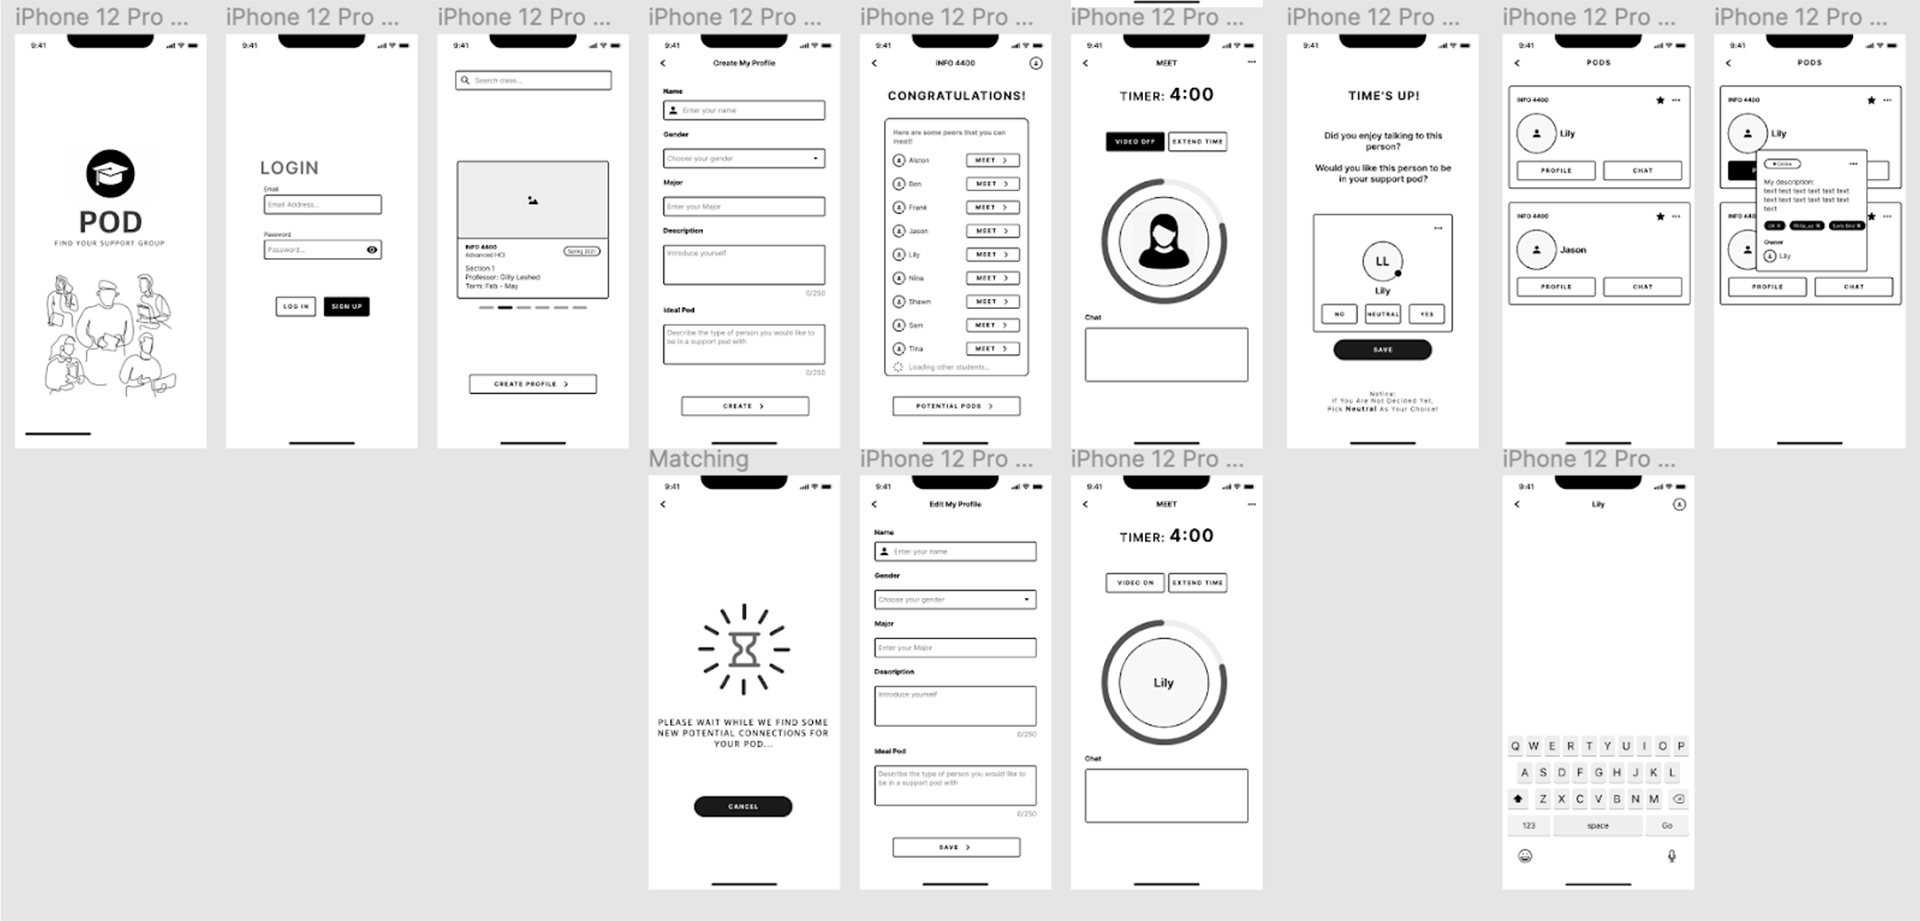
Finalized Prototype
The interactive features of the prototype are demonstrated in the following video, which can also be accessed via the link: <https://drive.google.com/file/d/1z42VL1z4nOZrW2xGi4dr4eJjbPoYwEjG/ view?usp=sharing>.
Reflection
Users are the most creative and best designers
As a new UX designer, I have realized and understood the importance of hearing users' authentic thoughts in the research stage since the first day. However, we usually underestimate the role that users could play in the design stage. I didn't realize how creative users could be until this project. Their design sketches have proved that users' design ideas could be a mindmap of future design and a starting point of prototyping.
I'm grateful for the opportunity to implement what I learned from classes into something that will mitigate users' struggles. Also, I appreciate all participants' time, effort, and patience throughout our project, which helped our team eventually deliver the design.
